
UK Supermarkets (market share)
- Details
- seraphim
- research || rankings
- Hits: 11038
i) UK data 2014 -- 2011 NEW ii) Ireland
ii) Tesco USA / international iii) Wal-Mart 1 2 iv) co-op v) waitrose
When considered as a whole the UK grocery market is steadily growing in size, being about 4% bigger today than it was a year ago. Growth in the upscale grocery market (Waitrose) has slowed but remains healthier than the overall market (7.5% last year --> 4.8% this year). In an effort to compete with discounters Aldi and Lidl last year Tesco lowered prices on essential items like eggs and milk by nearly 25%. In May 2014 Sainsbury's reported slowest annual profit growth in over a decade ! At Tesco, growth in economy label products which includes 'Everyday Value' is +13%, this growth is at the expense of premium label products (-6% yoy). Tesco online sales up 11% in 2013. In Asda's April 2013 income report it pegged March 2013 weekly discretionary income at £152, down from £153 March 2012, £159 March 2011. The horsemeat scandal of 2012/2013 impacted a number of the industry's big names including Tesco (frozen burgers -43%) and Asda (up to 50% of corned beef contains horsemeat; Asda quarter ended Jan 2013 like-for-like sales a stagnant 0.1%. Grocers account for approximately 77% of national food sales - sales by grocers for July 2013: £24.81b vs £23.93b. Since March 2013 Aldi+Lidl combined market share exceeds that of the Co-operative. Tesco 2q2013 sales flat.
In June, sales of own label products in Ireland grew +3.8%, that contrasts with -3.6% for brand labels; Ireland prices increased 4.8% in September versus 4.2% in UK (both regions up from July: 4.6%, 3.9% respectively). Tesco's problems in Ireland - market share for Sept 2013 drops like a rock to 26.8% (was 27.6% July 2013, 28.7% Sept 2012, 30.5% Nov 2011). meanwhile Dunnes experiences organic growth and SuperValu buys #6 Superquinn (-> 222 stores). background: In 2008 Coop acquired Somerfield - in order to get approval from competition regulators some of the stores were sold.
 October 2014- industry-wide deflation : overall grocery prices down -0.2%. disinflation intense competition has all major retailers cutting prices even on staple items like eggs and milk. This is further exacerbated by Tesco which is bleeding market share faster than any other. Waitrose share reached a record 5.2% in October thanks to positive sales growth every since March 2009. Market exhibits polarization (mainstream losing ground to both premium and discount stores). industry-wide till sales up +0.7%. June 2014- Industry-wide grocery sales up 2.8% versus 1.7% previous month (was lowest in 10 years). Inflation of 0.8% is the lowest on record. Tesco 0.3-> 28.9% only top 3 grocer to lose share. others were Morrisons 11.7-> 10.9%, Coop 6.3-> 6.2%). Tesco, Morrisons to resort to price cutting to stay competitive with discounters Aldi +35.4%, Lidl +22.3%.
Ireland: 2014: Musgrave rebrands all of its Superquinn stores as Supervalu. March 30: Tesco 26.0% -6.6% Supervalu 25.2% -1.2% DuDunnes 21.9% -3.9% Aldi 7.9% +21.9% Lidl 7.5% +11.1%. Tesco down big in February 2014- share to 26.0% from 27.7% / 26.2% in January on sales decline of -0.7%. % of Irish visting stores: Tesco 87%, SuperValu 63%. Inflation @2.9% vs 6% previous year. Also note that the average shopper spent €12 less on fresh fruits and vegetables. Aldi gains ground (5.9-> 7.2%). Average trip to Lidl up £2.
|
share growth |
Tesco 28.8% -3.6% |
Asda 17.3% +1.0% |
Sainsbury 16.1% -3.1% |
Morrison 11.0% -1.8% |
Waitrose 5.2% +6.8% |
Aldi 4.8% +27.3% |
Lidl 3.5% +18.1% |
|
growth |
28.8% -4.5% |
17.4% +0.8% |
16.2% -1.8% |
10.9% -1.3% |
5.1% +4.5% |
4.8% +29.1% |
3.5% +17.7% |
|
growth |
28.8% -4.0% |
17.2% +1.2% |
16.4% +0.3% |
11.0% -1.9% |
4.9% +3.6% |
4.8% +29.5% |
3.6% +18.3% |
|
share |
28.9% -3.8% |
17.0% +0.9% |
16.6% +1.2% |
11.0% -3.8% |
4.9% +3.4% |
4.8% +32.2% |
3.6% +19.5% |
|
June 2014 share |
28.9% -1.9% |
17.1% +3.6% |
16.7% +3.0% |
10.9% -3.8% |
5.0% +6.9% |
4.7% +35.4% |
3.6% +22.3% |
|
May 2014 share |
28.7% -2.4% |
17.3% +2.0% |
16.6% +0.3% |
11.0% -3.6% |
5.1% +0.1% |
4.7% +36.1% |
3.5% +20.9% |
|
Apr 2014 share |
28.6% -3.0% |
17.4% -0.5% |
16.5% -1.7% |
11.1% -3.8% |
5.0% +4.5% |
4.6% +35.3% |
3.4% +17.2% |
|
Mar 2014 growth |
28.7% -0.6% |
17.5% +0.3% |
17.0% +2.2% |
11.1% -3.2% |
5.0% +6.2% |
4.3% +33.5% |
3.2% +16.6% |
|
Feb 2014 growth |
29.2% -0.4% |
17.3% +0.5% |
17.1% +2.7% |
11.3% -2.5% |
4.9% +5.6% |
4.1% +32.0% |
3.2% +17.2% |
|
Jan 2013 growth |
29.6% +0.2% |
17.1% +0.8% |
17.1% +3.1% |
11.5% -1.0% |
4.8% +6.4% |
4.0% +29.4% |
3.1% +17.5% |
|
Dec 2013 growth |
29.9% +0.4% |
16.9% +0.6% |
16.8% +1.8% |
11.6% +0.8% |
4.7% +6.7% |
4.0% +30.7% |
3.1% +15.5% |
|
Nov 2013 growth |
29.8% +0.7% |
17.2% +0.8% |
16.8% +2.6% |
11.5% +1.5% |
4.8% +8.8% |
3.9% +31.1% |
3.0% +13.8% |
|
Oct 2013 growth |
30.1% +0.4% |
17.2% +1.0% |
16.7% +3.7% |
11.2% +1.0% |
4.9% +7.6% |
3.8% +31.7% |
3.0% +13.1% |
|
Sept 2013 growth |
30.2% +1.9% |
17.3% +2.4% |
16.6% +5.1% |
11.1% +1.6% |
4.9% +9.7% |
3.7% +32.7% |
3.0% +14.3% |
|
Aug 2013 growth |
30.2% +2.0% |
17.1% +2.1% |
16.5% +4.9% |
11.3% +1.8% |
4.8% +9.1% |
3.7% +31.9% |
3.1% +14.9% |
|
July 2013 growth |
30.1% +1.8% |
17.0% +2.0% |
16.5% +3.8% |
11.7% +1.8% |
4.8% +10.9% |
3.6% +29.8% |
3.1% +10.9% |
|
April 2011 |
30.9% |
17.0% |
16.6% |
12.1% |
4.3 % |
2.2% |
2.6% |
February 2014- Iceland Foods reaches high at 2.3%, Aldi + Lidl combine for 7.3% up from 6.0%. Inflation at 2.1% lowest since July 2010 with total grocery till +2.4% (exceeded only by Waitrose, Sainsbury's, Aldi, Lidl and Iceland). January 2014- 3.8% growth at Sainsburys gives it market share tie with Asda @17.1%. Inflation is now at 2.5% the lowest since October 2012. Sales of Premium products outperform Value items. Online grocery shopping more popular: 15% of Britons shopped online that's up 22%!

May 2014- 12 weeks to April 27, polarizing shift in grocery shopping: top four players lose significant share to discounters; Tesco 30.0-> 28.7% sales -2.4%, Morrison 11.6-> 11.0% -3.6% consequently upscale Waitrose 4.9-> 5.1% +6.3%, Aldi 3.5-> 4.7% +36.1%, Lidl 3.0-> 3.5% +20.9% make gains. April 2014- 12 wks to March 30, Farmfoods reaches record share of 0.8%. inflation at new record low now only 1.8%. Morrison's issued profit warning in March, sales down -3.8% makes it worst performer. Waitrose had to grow 4.5% just to hold on to its share of 5.0%. overall market growth 0.6%. March 2014- Since 2010 the big discounters Waitros/Aldi/Lidl have taken 3.5% share or 4.4 billion pounds per year in sales away from the competition with Aldi recording the strongest growth (33.5% yoy -> 4.3% share in March). Waitrose also hit a record share with 5.0% of the market; this comes at the expense of Tesco (28.7% is its lowest ever). Only Tesco (-0.6%) and Morrisons (-3.2%) recorded a decline in actual sales. Grocery inflation @1.9%.. market growth @2.2%.
April 27, 2014: Market polarization takes effect full swing : Upscale Waitrose, Discounters Lidl, Aldi continue chipping away at top four. Although Tesco suffered a 2.4% fall in sales during the 3-month period ending April 27 it did not lose share versus the previous month (March 30) which was the case with Morrisons; Morrisons lost 100m til sales or 3.6% of its quarterly revenue, to fall to 11.0%. More competition means sales growth not enough to grow market share : Asda sales gain of 2.0% is the biggest margin of growth since September 2013 however that didn't result in any appreciable gain in share (steady at 17.3% and actually down from 17.5% last month). % sales growth recorded by top 4: -2.4%, +2.0%, +0.3%, -3.6% vs bottom 5: +0.1%, +6.3%, +36.1%, +20.9%, +3.6%. Inflation spirals down to 1.5%, the lowest since June 2010. Meanwhile, Sainsbury's says its profit growth when annualized is the lowest it's been in more than ten years.

March 30, 2014: Top 5 grocers all record negative sales growth : (12 wks) Tesco -3.0%, Asda -0.5%, Sainsbury -1.7%, Morrison -3.8%, Co-op -1.0%. Market share change: top 5 all dropped worst performer is Tesco 29.7% -> 28.6%; Asda 17.6% -> 17.4%, Sainsbury 16.9-> 16.5%, Morrison 11.6-> 11.1%, Co-op 6.2-> 6.1%. Middle 3 continue posting growth: Waitrose 4.8-> 5.0%, Aldi 3.4-> 4.6%, Lidl 2.9-> 3.4%. Iceland sales up 2.8% but market share didn't growth (2.1%). Farmfoods share to 0.8%
March 2, 2014: Aldi (33.5% and Lidl (16.6%) continue to take market share away from mainstays Tesco (-0.6% -> 28.7% share.. lowest ever), Morrisons (-3.2% -> 11.1% share) and Asda - Asda sales just barely avoided negative territory with growth at only 0.3% .. the slowest rate of growth for any of the top 12 grocers. Inflation continues its downward trend hitting a four year low of 1.9% for the 12-week period (inflation down for the 4th consecutive month.. 3.0% in Dec, Jan 2.5%, Feb 2.1%). Waitrose's share hit 5.0% for the first time ever - is benefiting from a surge in online sales which now represent 7-8% of total sales).
February 2, 2014: Aldi and Lidl continue growing at a torrid pace: Germany's discount grocer now hold a combined share of 7.3% up from 6.0% Feb 3, 2013. 2 of the top 4 supermarkets (Tesco & Morrison) were the only top 10 grocers to record a decline in sales (-0.4% & -2.5%); Iceland's share of the market is now at a record high of 2.3%. At 2.1% grocery inflation now at the lowest level since July 2010. Overall market growth was 2.4%. 
January 5, 2014: Sainsbury's reaps the benefits of holding onto its 17.1% share - it is now tied with Asda whose share fell
17.5-> 17.1% (but still up from 16.9% December 2013). Til sales: Asda 4,664.397m +36.830 Sainsbury 4,653.671m +137.965. It's only a matter of time until Sainsbury's leapfrogs Asda (sales are currently growing at 3.1% vs under 1% for both Asda and Tesco). Morrisons share down to 11.5% from 11.6% last month (12.1% last year) attributable to its lack of presence online (15% of Britons did some grocery shopping online - up 22%). industry-wide inflation now only 2.5% - lowest since October 2012. sales of premium products outperform value items.
December 2013: December 2013- Third quarter sales fall at Tesco fall hard: UK -1.5%, Ireland -8.1%; that after sales holding steady the previous quarter (UK 2q13). Grocery market sales for Dec'13 still lag overall inflati on (2.8% vs 3.0%) however inflation remains near its one year record low of 2.9% recorded in November. October through December 2013: 50.1% of British shoppers visited at least one of the discount food retailers Aldi, Lidl up from 46.1% last year. Also in Dec'2013 it was revealed that weekly average household disposable income down -7% to £489.
for the 12 week period.. til sales at Aldi up nearly 250 million not only bringing it closer to #6 grocer Waitrose but also putting distance between it and the other Germany-based food retailer Lidl (sales up by only 109m).
 Inflation (+3.0%) now exceeds total market growth in supermarkets (+2.8%).
Average household disposable income -7% to £489. In just the last four weeks, Asda market share nosedives (17.2-> 16.9%) and still even more loss versus last year at this time (17.3%). Tesco sales fall in 2013 3q: UK -1.5%, Ireland -8.1%. October through December 2013: 50.1% of British shoppers visited at least one of the discount food retailers Aldi, Lidl up from 46.1% last year.
November 2013: 12 weeks to November 10 - grocery inflation at 3.7% exceeds industry-wide sales growth of 3.2% -> less food purchased. Co-op was the only grocer to record negative sales growth (-0.4%). positives: # of shoppers visiting Aldi supermarkets up 16% year over year & they are spending more at Aldi ! +15% per shopper. Sales of premium label products up at Tesco (+16%) and Sainsbury's (+12).
October 2013: 12 weeks to October 13 - grocery inflation at 4.2%, same as a month earlier, remains highest since February 2013 (4.3%). Asda, Tesco, Morrison's sales growth rates all under 1% versus 3% market average. Aldi continues growing at a torrid pace, this month's 12-week results are notable since it's the first time since July 2013 report that Aldi market share actually went up (3.7% to 3.8%). 
September 2013: 12 weeks to September 15 - Aldi's yoy sales growth was a record however market share didn't change since last month. The grocery market as a whole experienced sales growth of 4.2% however Sainsbury (+5.2%) was the only top 4 grocer to exceed that (Sainsbury also only grocer in the top bracket to grow its market share over the last year (16.4-> 16.6%). Despite growing sales slightly, at Co-op market share falls month-on-month (6.6->6.5%) for the first time since earlier this year (Nov 2012 6.5% vs 6.1% Apr 2013). note - at 4.2%, grocery inflation in UK lower than Ireland (5.5-> 4.8%). Aldi grew 32.7% in UK, 24.3% in Ireland. Aldi+Lidl = 8.7-> 6.7% share of UK market; 15.1-> 14.9% Irish market. Grocery inflation: highest level since February 2013 when it was 4.3%.
August 2013: 12 weeks ended August 18 - Tesco & Asda down year on year but both up +0.1% from the previous month with each recording sales growth of around 2%. Sainsbury's up versus previous year but still down -0.2% last two months (16.7 -> 16.5%). industry-wide sales up £0.93648b 3.0% to £31.72628b. Waitrose adds 0.2% share (4.6->4.8) vs 0.3% last month (4.5->4.8).
July 2013 : Discount retailers Lidl (2.9%->3.1%), Aldi (2.9->3.6%) and #6 Waitrose (4.5%->4.8%) continue taking business away from the top 4, all dropped q2q and qoq except for Morrisons which was +0.1% versus 1 month ago and Sainsbury's which held on to its yoy share thanks to market beating sales growth (3.8% vs 3.7%). Inflation at 3.9%. -- UK grocers list here , grocery stocks
June 2013 : 12 weeks to June 9, grocery inflation 3.9% same as period immediately preceding this one d espite overall market growth falling from 3.2% (June 2012) to 3.0% - previously propped up by Diamond Jubilee. Sainsbury's continues its climb, sales +3.5% (market leading) giving it a 16.7% share (+0.1%). The gap between Asda and Sainsbury's gets a lot smaller - Asda goes from 17.2% (12 wks to May 2013) to 16.9%. Waitrose sales growth 10.4% (3X market average). Co-op drops to 6.3% from 6.5% last November. During the previous period 3 weeks to June 10, 2012 both Tesco and Morrisons each lost 0.4% market share. For the week of June 3, 2012 diamond jubilee caused brief spike in market growth to 11.3% (+£213m). Sainbury's experienced strong organic growth.
April 2013 : April full month food sales fell -4.1%, the steepest decline for that sector in two years - overall retail sales (-1.3%) were buoyed by fuel sales (-1.4% w/o), household goods (+3.8%) and apparel (+0.8%). Food prices and consumer confidence are being blamed for the drop in food sales. Consumers exercised caution in food spending and why not? overall UK inflation of 2.4% still exceeds income growth. UK April Budget deficit +14.6% to £10.2b. For the quarter (2013 1st) overall consumer spending +0.1%. May 12 3mo market share - Aldi 3.5% (+31 .5%), Waitrose 4.9% (+12%), Lidl 3.0% (+8.9%), Tesco 30.2% (+1.7%), Asda (17.4% -> 17.2%); grocery inflation +3.9%, Sainsbury's only top 4 supermarket to record market share growth (16.5->16.8%).
April 2013 Grocery Share : 12 weeks to April 14 grocery inflation falls to 3.8% from 4.2% qoq while market growth falls to 3.6% from 3.9% a month earlier. Sainsbury's continues to do well with sales growth at 5.4% in April; its yoy growth to March 2013 was 6.2% which did exceed growth in the overall market (3.9%). February 2013: 12 weeks ended February 17, 2013 market growth rate picks up 3.2% -> 3.7% but still lags general inflation (4.3%).
Asda: Fiscal 2012 sales +4.5% to £22.8 billion. Parent company Wal-Mart plans to pump more than £700 million into British operations next year. 12 weeks ended May 12, 2013 Asda share of the British market fell to 17.2% from 17.6% 12 weeks ended April 14. 1st quarter 2013 like-for-like sales +1.3% (4q2012 +0.1%), not bad considering Morrisons was down 1.8%; 1q2013 online sales +17%. Price Guarantee competes with Sainsbury's Brand Match.
The Co-operative Group: Year ending January 5, 2013 - Annual food sales up 1.3% though like-for-like food store sales down by -0.7%. Food operating profits down -9.5%. Fiscal 2012 food revenue £7,442.2m (+1.3%), operating profit £288.4m. 2816 stores employ 72,670 people. mid 2013 market share at 6.3%.
 Waitrose: recently passed the 5 million customer threshold. 1q2013: sales +11%, not unsurprising given that it passed the horsemeat scandal test unscathed (no horse dna found in its food). Fresh meat sales +12%, online grocery sales +50%. Fiscal 2012 - online sales £300m, total revenue £5.76b (up from £5.40b), operating income £292.3m +12.2%.
Morrisons: 2013 sales improving: +1.2% in 12 weeks to May 12, +0.3% in April, -1% March, -1.3% Feb.
August 2012: 12 weeks ended July 8, 2012 market growth rate slows from 4.2% --> 2.1% due mostly to a drop in price inflation: 6.2% --> 3.8%. The overall growth rate is being propped up by strong demand for frozen food products, inflation, and higher same-store sales at midsize grocers like Waitrose. Morrisons is growing slowly but surely, the company opened close to 20 new stores in 2012 with most of those locations featuring a larger selection of produce The prior period reported on in June by Kantar included diamond jubilee celebrations, which alone caused industry-wide spending to climb by $334 million. Note: In 2012 Tesco issued a profit warning for the first time in two decades.
American retailer Safeway had operated 121 locations in the United Kingdom until 1987, the year the division was sold to Argyll Foods for $1.0 billion. The supermarkets continued to operate under the Safeway banner until 2005 when Morrisons acquired them.
DYK? Galen Weston Sr, 28% owner of Loblaw Companies, Canada's largest grocery chain through his stake in George Weston Ltd, has also held senior positions in the UK (chairman of Selfridges) and Ireland (Brown Thomas).

As of February 2013 Britain's #2 grocery chain Asda oversees 565 locations serving 18 million people across the UK, that's up from 555 stores in September. In the most recent quarter (1q) encompassing the 14 wks ended April 2013, Asda said sales at stores open more than one year is up +1.3%. By comparison 1q2013 like for like sales at Morrisons down -1.8%. 14 weeks to January 2013: Asda same store sales +0.1%, that's down from +0.3% in the quarter prior (November 15, 2012). By comparison like for like sales at Tesco is up +1.8% (Jan 5, 2013).
Tesco, the world's 3rd largest grocer by sales is still the most popular place to buy food in Britain, however the competition is slowly eroding away Tesco's market share (in 2013 €4.4 billion in annual sales shifted from the top 4 retailers to discounters Aldi, Lidl and Waitrose) ; In early 2012, Tesco held less than 30% (29.7%) of the UK market for the first time since 2005 (quarter ended February British sales fell -1.6% despite overall revenue up +2.2%). In March 2014 Tesco's share of the UK market hit a 10 year low of 28.7% (it and Morrisons -3.2% were the only two grocers to experience a decline in sales); meanwhile Waitrose (5.0% on 16.6% growth) and Aldi (4.1% on 33.5% growth) hit record highs. In Ireland Tesco also hit a low with its share falling to only 26.0% from 27.7% the previous year despite 87% of residents visiting its stores. 4Q Jan 5, 2013 quarter, like-for-like sales +1.8% beats #2 grocer Asda (+0.1%). 1Q 13 weeks ending May 26, 2012 sales at Tesco's mainline operations fell -1.5% despite growth in the market as a whole (competitor Fresh & Easy reported a growth of +3.6% in sales). 2q2013 sales flat despite market growth averaging ~3%.. 3q2013 tesco sales fall -1.5% in the UK, -8.1% in Ireland. 4Q2013 tesco earnings fall -3% the biggest quarterly decline in three years.
 Bright spots for Tesco are: online sales (up 11% in 2013) and Tesco Express (sales growth at 1.1%). Also, Tesco is in the process of basically giving away 50% of Tesco Japan (will invest £40M into the company when Aeon agrees to take over half of it for free). Ireland seemed to be a bright spot for the company, there sales remained steady (+0.4% quarter ended May 2012) and market share had improved (27.4% --> 28.4% as of 12 weeks ending May 13) however by June of 2013 Tesco lost a lot of those gains (12 wks to June 2013 - sales down 1% lowering market share to a one year low of 27.7% -0.9%) - June 2013 market share loss was twice that of Dunnes -0.5%. Despite problems in Japan, Tesco expects international business to account for 36% of revenue in 2014 up from 30% in 2011.
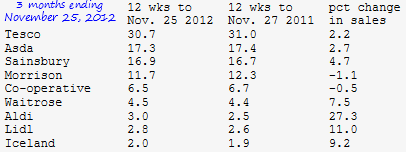
In 2008 Tesco became the first British supermarket to carbon-footprint label own-brand products. Taken over the three month period ending in June November 25, 2012 Tesco's market share was down slightly both from the September 2012 period (30.8%) and the November 2011 period (31.0%). The 30.7% share is an improvement over the the 12 weeks to Oct. 28, 2012 (30.5%).
Mounting Losses At Tesco USA, Japan reduced full year earnings to just £120 million in 2012 (table to right)
In December 2012 Tesco signaled that it may be on the verge of leaving the US market altogether. Losses at Tesco's American subsidiary Fresh & Easy will reach £850 million by February of 2013. With like-for-like sales growth below the market average (4-5%) Tesco is expected to at the very least divest half of its share. Tesco also operates in 13 other countries but the United Kingdom is the source of more than half of its cash flow, 66% of revenue and profit. Berkshire Hathaway owns 5.08% of Tesco stock. 2013q3 sales growth: China -1.5%, Malaysia +1.7%, South Korea -5.1%, Thailand +4.4%, Czech Republic -9.2%, Hungary +0.6%, Poland -6.6%, Slovakia -2.1%, Turkey -7.0%, Ireland -0.3%, United States +1.8%.
Walmart's food business is also growing domestically; it now accounts for 25% of US grocery sales
Asda contributes approximately 25% of Walmart's international sales. ($33b, 2012 sales +1%) (table below) note: 55% of Walmart US sales is in food
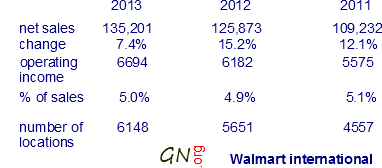 For Wal-Mart, operating margins are much higher stateside (FY2013 7.83% up from 7.72%) than they are abroad (4.95% up from 4.91%). Between 2011 and 2013 Wal-Mart USA net locations up by 201 units (+5%) vs 61 international (+21%).
12 weeks ended May 12, 2013: total grocery sales +1.2% vs +0.3% in the previous period (April 14). Morrisons share is 11.6% (vs 11.9% last year) however its problems appear to be in the past; Morrisons sales grew for the second straight month (1.2%, 0.3%) after declining every month from September 2012 through February 2013. Sales growth for Morrisons should continue into the coming months with its recent signing of a £170 million deal with Ocado Group plc (online shopping). Waitrose is in record territory at 4.9% on 12% sales growth. year-on-year, Sainsbury's only top four chain to grow market share (16.5% -> 16.8%). Tesco 30.8->30.2% (+1.7%), Asda 17.4->17.2% (+1.3%), Sainsbury 16.5-> 16.8% (+5.6%), Morrisons 11.9-> 11.6% (+1.2%), Co-op 6.5-> 6.2% (-1.2%), Waitrose 4.5-> 4.9% (+12%), Aldi 2.8-> 3.5% (+31.5%), Lidl 2.8-> 3.0% (8.9%), Iceland 2.0-> 2.0% (+5.2%). grocery inflation at 3.9% down significantly from 2 months prior (Feb 2013: 4.3%).
12 weeks ended February 17, 2013: Tesco market share down for a couple reasons: 1) during the 2012 period, Tesco gave customers £4 worth of vouchers for ever £40 spent which resulted in an unusual boost in company sales that quarter 2) the 2013 period happened during the horsemeat scandal (sales of frozen ready meals -13%). Iceland sales grew +10% -> frozen food market remains healthy despite horsemeat scandal. Aldi (+30%) starts putting distance between it and Lidl - market share spread now 3.3% vs 2.8%, compared to 3.0% vs 2.8% three months earlier.
Latest (2013-blue) Previous (2012-brown) Sales Growth (green)
|
market share inflation: sales: |
Nov 10 2013 +3.7% +3.2% |
October 13 +4.2% +3.0% |
Sept 15 +4.2% +4.2% |
August 18 +3.9% +3.0% |
July 7 2013 +3.9% +3.7% |
April 14 +3.8%
|
April 15 2012
|
| Tesco |
30.5->29.8% sales +0.7% |
30.8->30.1% sales +0.4% |
30.9->30.2% +1.9% |
30.9->30.2% +2.0% |
30.7->30.1% +1.8% |
29.9% +1.0% |
30.7% |
| Asda |
17.6->17.2% sales +0.8% |
17.6->17.2% sales +1.0% |
17.6->17.3% +2.4% |
17.5->17.1% +2.1% |
17.3->17.0% +2.0% |
17.5% +3.0% |
17.6% |
| Sainsbury's |
16.9->16.8% sales +2.6% |
16.6->16.7% sales +3.7% |
16.6->16.4% +5.1% |
16.4->16.5% +4.9% |
16.5->16.5% +3.8% |
16.9% +3.0% |
16.6% |
| Morrisons |
11.7->11.5% sales +1.5% |
11.4->11.2% sales +1.0% |
11.4->11.1% +1.6% |
11.5->11.3% +1.8% |
11.9->11.7% +1.8% |
11.5% +0.3% |
11.9% |
| The Co-operative |
6.5->6.3% sales -0.4% |
6.7->6.4% sales -1.2% |
6.8 ->6.5% +0.3% |
6.8 -> 6.6% +0.1% |
6.6 -> 6.4% +0.2% |
6.1% -1.8% |
--- |
| Waitrose |
4.6->4.8% sales +8.8% |
4.7->4.9% sales +7.6% |
4.6 ->4.9% +9.7% |
4.6 -> 4.8% +9.1% |
4.5 -> 4.8% +10.9% |
4.9% +12.0% |
4.5% |
| Aldi |
3.0->3.9% sales+31.1% |
3.0->3.8% sales+31.7% |
2.9 ->3.7% +32.7% |
3.0 -> 3.7% +31.9% |
2.9 -> 3.6% +29.8% |
3.4% +31.1% |
2.7% |
| Lidl |
2.7->3.0% sales+13.8% |
2.7->3.0% sales+13.1% |
2.8 ->3.0% +14.3% |
2.8 -> 3.1% +14.9% |
2.9 -> 3.1% +10.9% |
3.0% +10.1% |
2.8% |
| Iceland |
2.0->2.0% sales +2.6% |
2.0->2.0% sales +2.3% |
2.0 ->2.0% +4.0% |
2.0 -> 2.0% +4.0% |
2.0 -> 2.0% +4.9% |
2.0% +7.2% |
2.0% |
12 weeks ended June 9, 2013: Since November 2012 gap separating Asda and Sainsbury's contracts - Asda goes from 17.2% (12 wks to May 2013) to 16.9%, Sainsbury's +0.1% vs June 10, 2012 but -0.1% vs May 2013. Waitrose sales growth 10.4% higher than market average but lower than Aldi (+29.9%). Co-op drops to 6.3% from 6.5% last November. Tesco lost 0.5% of market share compared to -0.4% in the previous period of June 10, 2012 . note - week of June 3, 2012 brief spike in market growth to 11.3% due to diamond jubilee celebrations. Sainsbury's organic growth gives it distinction of only top five grocer to record growth in share.
12 weeks ended November 25, 2012: Aldi continued gaining market share, now at 3.0%; Lidl at 2.8% is still in a better position than it was a year earlier (2.6%) however its share fell slightly since July (2.9%).
12 weeks ended July 8, 2012: 26.1% growth for Aldi pushing its market share to 2.9%; 11.5% growth for Lidl, pushing its market share to 2.9%
12 weeks ended June 10, 2012 : Upscale retailer Waitrose saw its market share go up 4.4% to 4.6%. Discount market continues to grow ! Aldi + Lidl = 5.6% (from 4.9%) with Aldi experiencing the biggest jump 23% to 2.8%.
Keep in mind that the fastest growth is occuring in the discount food market (led by Lidl, Aldi)
Ireland food retailing Market Share
12 weeks to February 2, 2014: Tesco sales dip: market share declines 27.7% -> 26.0% (after 27.8% -> 26.2% fall January 5, 2014). Tesco is still the king of the Irish market with 87% of residents visiting its supermarkets (versus 63% for SuperValu up by 30,000 people). Inflation down to 2.9% from as high as 6.0% the previous year.
12 weeks to January 5, 2014: Tesco 26.2% (vs 27.8%), Dunnes 23.9% (vs 24.1%), SuperValu 20.1% (vs 19.8%), Superquinn 5.2% (vs 5.5%), Aldi 7.1% (vs 5.9%), Lidl 6.4% (vs 5.7%).
12 weeks to November 10, 2013: Tesco market share falls fast (28.0-> 26.5%) unsurprisingly given that sales it recently reported third quarter sales in Ireland were down by -8.1%. This should be alarming to Tesco given that the competition recorded either stable market share (second worst performer Superquinn share down only -0.1%) or strong growth (discounters Aldi Lidl combined for 13.7% sales growth and improved share 12.5% up to 14.3%).
12 weeks to September 15, 2013: Dunnes, SuperValu grow at the expense of Tesco (-5.6% -> 1.9% fall in market share). SuperValu now controls Superquinn -- the combined store network = 222 stores.
12 weeks to July 7, 2013: Family spending down €67 yoy bodes well for discount grocers - only Lidl, Aldi, Supvervalue increased their share of the market. At current pace Aldi + Lidl will grow to 15% by year-end. market share held by discount retailers: 12.2% -> 14.4% on sales growth of 18.1%. For grocers not shown in chart share dropped 12.0% -> 11.6%. Market declined in size by -0.2% despite inflation at 4.65%, previous 2 months the decline was -0.2%, -0.1% respectively.
12 weeks to June 9, 2013: Discount grocers Lidl and Aldi outperform the market - combined share now at 13.8% up from 11.8% last year. Own label product sales +3.8% bests brand labels -3.6%.
12 weeks to April 14, 2013: grocery inflation 5.3% (down from 5.7% in March, 5.8% in February). Annual sales growth at Dunnes dips to 0.4% in April. Irish grocery inflation: April 2012: 1.8%, November 2011: 3.5%, April 2011: 1.9%.
|
Grocer inflation |
Feb 2, 2014 +2.9% |
Nov 10, 2013 +2.9% |
Sept 15, 2013 +4.8% |
July 7, 2013 +4.65% |
June 10, '12 +2.6% |
April 14,'13 +5.3% |
April 2012
|
| Tesco |
27.7-> 26.0% |
28.0-> 26.5% -6.0% |
28.7-> 26.8% -5.6% |
28.8 > 27.6% -4.4% |
28.6% +2.8% |
28.4% -0.9% |
28.2% |
| Dunnes |
24.1-> 23.8% |
23.0-> 23.6% -2.3% |
28.7-> 26.8% -5.6% |
22.2 > 21.5% -3.3% |
22.4% -5.0% |
22.5% +0.4% |
|
| SuperValu |
19.9-> 20.1% +0.7% |
19.3-> 19.4% 0% |
19.7% +1.8% |
19.4-> 19.5% +0.1% |
19.7% +1.3% |
19.8% +1.3% |
19.8% |
| Lidl |
5.7-> 6.6% |
6.3-> 6.9% +8.2% |
+13.1% |
6.7-> 7.4% +10.6% |
6.6% +7.3% |
6.6% +7.3% |
6.2% |
| Aldi |
5.9-> 7.2% |
6.2-> 7.4% +19.4% |
+24.3% |
5.5-> 7.0% +27.3% |
6.5% +2.8% |
+0.9% | 5.7% |
| Superquinn |
5.5-> 5.1% |
5.3-> 5.2% -3.9% |
28.7-> 26.8% -5.6% |
5.4 -> 5.4% -0.8% |
5.5% |
+28.5% |
Archived data below
UK
| Grocer | % share | date/period | change |
| Tesco | 29.7% (30.5%) | Feb.2012 (12 weeks Nov.27.2011) | na (-0.2%) |
| Asda | 17.5% | 13 weeks Sept.29,2012 | +0.1% |
| Sainsbury's | 16.6% | 12 weeks Jan.22.2012 | na |
| Morrisons | 12.1% | 12 weeks Nov.22.2011 | +0.1% |
| Waitrose | 4.6% | 12 weeks June.2012 | +0.4% |
| Aldi | 2.9% (2.8%) | 12wks July.2012 (12wks May.2012) | +0.57% |
| Lidl | 2.9% (2.8%) | 12wks July.2012 (12wks Jun.2012) | 0.32% |
Ireland
| Grocer | % share | date/period | change |
| Tesco | 28.4% | 12 weeks May.13.2012 | +1.0% |
| SuperValue | 19.7%(19.8%) | 12wks June.12 (12wks May.13) | -0.3% (+0.35) |
| Lidl | 6.1% | 12 weeks June.12.2012 | +0.5% |
| Superquinn | 6.1% | 12 weeks June.12.2012 | -0.6% |
| Aldi | 4.3%(5.2%) | 12wks June.12 (12wks May.13) | +0.9% (+0.87%) |
sources: Irish Examinier, Kantar Worldpanel, Grocery News