

Empire Company Sobeys supemarkets, gas stations competition locations
- Details
- seraphim
- companies
- Hits: 3761
Safeway Crombie Locations format / province Banking Positives Debt consumer price index
 Sobeys is one of only two grocery chains located throughout Canada, exception being the northern territories. As of 2021, Canada is home to 3 of North America's 19 biggest retail food companies (sales), Loblaw Cos #5, Sobeys #14, Metro #19; Prior to the Sobeys-Safeway merger #3 grocer Metro Inc had a higher market value than Sobeys even though quarterly sales were lower: $2.6116b (16 wks Sept 28) vs $4.427.7 (13 wks Nov.2). As a grocer, Sobeys began operations in 1924, the year Frank Sobey converted his father's meat shop into a grocery shop by adding more food items to its shelves. Though initially a family business, J.W.'s son Frank took the greatest interest in it and ultimately the company was passed down to him and his three sons Donald, Bill and David; David's son Paul Sobey is currently Empire Company's CEO and has held that position since 1998.
Frank Sobey's first grocery store was an extension of his father's meat shop which was founded in 1907 just after his father quit mining. Even before its quick transformation into a grocer, the meat business J.W. ran also distributed food door-to-door by horse drawn carriage (between 1998 and 2001 Sobeys distributed food through SERCA (20% of revenue) but later sold the division to Sysco for $440M or 7.5X ebitda).
In 1939 Sobeys opened its sixth location in Pictou County (NS) the same year Frank Sobey got married (to Irene). In 1945 Sobeys was one of the first supermarkets in Canada to use electric doors, improving customer service.
Initially, the Empire Company owned 62% of Sobeys. When Sobeys started trading publicly (Dec 1999) Empire increased its share to 72%. By 2007 Sobeys was a wholly owned subsidiary of Empire (June 15th, Sobeys 100 year anniversary: Empire Company paid $1.05B for complete control). In 2005 theater operations nearly doubled in size following the addition of 27 new locations (for $83M, numbered 57 in 2011).

Interest In Other Companies
- In 1983 Sobeys acquired 25% of Hannaford Brothers giving it an interest in the US market. That stake was later sold for $1.03B (July 2000).
- 42.8% of Crombie Reit May 2013 worth $622.7m up from $420.7m a year earlier (% is down from 42.9% February 2013, 43.0% November 2012, 44.6% before that), the largest landlord in Atlantic Canada (it also owns property in Quebec, Ontario, Saskatchewan, Alberta). It was founded in 1964 as a real estate investment company (shopping malls and strip malls) twelve years prior to being made a subsidiary of Sobeys Stores Limited in 1976. Much of its portfolio of office space was acquired in the 1990's when it purchased interest in Halifax Developments Limited. In December 1993 Sobeys paid $12.7M to increase its interest from 36% to 100% (full control). Empire's current president and CEO Paul D. Sobey, was previously chairman of Wajax Income Fund, so you can be sure Empire Company knows the real estate business.
--> Crombie Reit has grown quickly over the last couple years. Between December 31, 2009 and March 31, 2012 total equity up +181%: $246.97M --> $694.67M, total market capitalization +85.4%: $347.7M --> $644.7M, net property investment +24.1%: $1314.611M --> $1631.73M even though DEBT changed only +21.82%: $817.227M --> $995.571M. February 2013 update: Crombie Reit market capitalization now $1350.8 billion (Empire Co owns 42.9% -- August 2013 42.7% gives Sobeys total equity interest of $527.1m down from $553.0m August 2012).
--> Crombie Reit starts trading publicly in March 2006 at the same time Empire Co. sells it 44 properties for $468.5M (reason why Empire only owns about half of all shares). Crombie Reit's largest property is the Avalon Mall in Saint John's, Newfoundland. According to Sobeys 1Q2014 quartery report (period ending August 3rd) Crombie
- March 15, 2012: Sobeys completes the acquisition of 236 of Shell's 1600 Canadian gas stations. Only 47 of the gas stations are in Atlantic Canada. Sobeys owns another 24 Fast Fuel locations in the maritimes (up from 16 in 2011).- Wajax Income Fund investment was sold off in 2011 (artifically boosted profit for Sobeys in 1H2011). Final closing price arrangement was made in the 2q2012
In 1982, Empire Company Limited went public on the Toronto Stock Exchange. For the year ending April 30, 1998, Sobey's revenue stood at $3.3 billion with assets close to $2B and full fledged supermarkets numbering over >100. Only one month after taking over IGA parent Oshawa Food Group, Sobeys Stores Limited went public in December 1999 (Empire Company Ltd owned 62% of equity at the time, also publicly traded). In June 2007 Emipire purchased the other 28% for $1.06B and subsequently Sobeys went private, again, delisting from the TSX; the takeover was at a 53% premium to its final trading price.
 Crombie Reit
As of May 2013 Crombie Reit has interest in 13,872,103 gross square feet of leasable area. Largest properties: Avalon Mall, Newfoundland (595th), Aberdeen Business Centre, New Glasgow (401th). Nearly all properties >100th in size are in Atlantic Canada however the company has a couple large retail plazas in Quebec (Greenfield Plaza 183th), Saskatchewan (River City Centre 160th) and Ontario (Rose City Plaza 126th). Full list here.
As of February 2013 Empire Cos interest in Crombie is 42.9% that's down from 43.0% in Nov 2012, 44.6% in Feb 2012, 45.9% 2011, 46.5% Jan 2011.
Sobeys operates an extremely diversified grocery business (horizontal integration). In many cases Sobeys even owns the malls/complexes which house its supermarkets meaning that it can control what kinds of business can move into the area.
* Vertical integration bolstered by its chain of Needs convenience stores
* Reported the highest annual rate of same store sales growth in each of the last six years (2006-2013) vs Loblaws, Metro. In Fiscal 2012 same store sales grew at +1.4% (though only +0.7% in the 4q).
* In British Columbia Sobeys had next to no market share until 2007 when it acquired Thrifty Foods (discount retailer) for $253.6M. Initially there were 20 locations, by the end of 2011 there were 26 (+3 on the year). On the Island of Vancouver Thrifty Foods holds as much as 30% of the discount food market.
* Launches IGA Extra (full fledged grocery supermarket) in Ontario and Quebec in an effort to gain share away from Provigo and Loblaws. According to analysts, this approach is working.
** Sobeys is being proactive.
* Empire runs Canada's second largest Cinema company. That presents opportunities with regards to advertising. As of February 2013 Empire Theaters has 434 screens at 52 locations across Canada (up from 386 and 51 in early 2011). Empire Company also has a 50% voting interest in the Canadian Digital Cinema Partnership (upped by 21.8% in 2q2013 thanks to $7.6m transfer of projector equipment, other company involved is Cineplex). Fiscal year ended May 5, 2012.
August 3, 2013 - Empire Theatres last quarter as part of Sobeys - accounted for most of the $55.0m (+13.2%) sales from discontinued operations.
June 27, 2013 Update - Empire Company Ltd sells all its theatres for $255 million in two separate transactions. The largest is a $200 million agreement with Cineplex involving 24 threatres with 170 screens in Atlantic Canada (paid in cash), the other sees 20 theatres with 179 screens in Ontario and Western Canada going to Landmark Cinemas ($31m cash, $19m equity). The deal comes just two weeks after Sobeys committed to an all cash transaction in the amount of $5.8 billion for Safeway - At the time Sobeys said $1 billion of that money will come from asset sales so the $255m sale of the theatre business shouldn't come as a surprise.
* Freshco (launched in 2011, only in Ontario) is successfully taking on No Frills on Loblaws home turf of Ontario. The discount food market is big in Ontario (No Frills sales exceed $3B there) and so far the other big grocer, Metro has no answer for Freshco or No Frills. The biggest competition to Freshco in the forseable future is Wal Mart.
* Total debt is just over $1.1B (August 6, 2011) which is down from $1.556B (May 3, 2008) compared to $6.698B at Loblaw Companies (March 24, 2012). In fact, between January 2009 and December 2011 Loblaw's total debt increased +42.8% to $6.707B. August 2013 debt: Empire Co total funded debt $948.3m (+$2.4m vs Aug 2012) $870.3m of which was long term debt (-4.3%), $75.0m due within 1-year (+107%), $3.0m bank indebtedness (-40%).
* Is collaborating with the Bank of Montreal in discount banking much like Loblaw Companies partnership with CIBC. Sobeys agreement with BMO was announced July 3, 2003. By the end of 2011 Bank of Montreal automated machines could be found in over 100 Sobeys locations across Canada. There's also the club Sobeys mastercard which earns points that can be redeemed at Sobeys and IGA.
--> This will lead to increased traffic at Sobey's stores, a positive for any store.
Safeway
On June 12, 2013 Empire Company's offer of C$5.8 billion cash for Safeway Canada was accepted by the California-based retailer. The deal increases Empire Company's locations from 1575 to 1788. Most Safeway Canadian stores are in Western Canada which is great since Empire Company didn't have much market share out there (BC is home to only 32 Empire locations, but Safeway has 75 stores there, BC is home to 3 Sobeys supermarkets but 75 Safeway). The deal will close during 4q2013. The deal gives Sobeys leading grocery market share in fast growing Alberta, annual revenue upped to $24 billion.
Financing for the deal - As of February 2, 2013 Empire Company had only $370m in cash not enough to pay for Safeway. According to Sobeys corporate brass funds will come from an Empire equity issue and asset sales including $1.0 billion sale and leaseback of Safeway Canada real estate. $255m came from the sale of Empire Theatres (26 theaters, 218 screens in Maritimes and Ontario). November update: Empire financed the deal through a July 2013 equity issue worth $1.85b + Sobeys bond sale in August $990m + $990m from the sale of 70 Safeway properties to Crombie + $1.97b from cash + credit. more money to come when Sobeys complies with Competition Bureau order to sell 23 Sobeys/IGA/Safeway supermarkets.
What Empire Company gets - 213 grocery stores (199 in store pharmacies) most in Western Canada, 12 manufacturing plants, 62 fuel stations, 10 liquor stores (Empire already runs one of Alberta's largest liquor store chain Lcbo. Synergies of $200 million.
Altogether excluding gas stations operated by both companies (Fast Fuel, Shell), Empire Company locations Canada-wide go from 1300 to 1523 (c May 2013). 168 / 223 new stores are in Alberta (93) and BC (75).
Financials - Last fiscal year sales at Safeway Canada totaled $6.7 billion (ended March 23, 2013). Operating profit C$428 million, adjusted ebitda C$513 million. Effective acquisition multiple of 7.4X
What the Safeway deal excludes - 189 gas stations, $300 million of Safeway Canada public debt due in 2014.
Safeway locations by province - BC 75, Alberta 93, Saskatchewan 16, Manitoba 33, Ontario 6, Rest Of Canada 0.
Sobeys locations by province Excluding Fuel Stations
May 2013 BC 35 (5 Sobeys/IGA, 30 Thrifty Foods), Alberta 126 (90 Sobeys/IGA, 36 beer stores), Sask 15 (all grocery), Manitoba 31 (27 Sobeys/IGA), 327 (174 Sobeys/Freshco + 147 Foodland), Quebec 414 (IGA Extra + small format Benichoix, but no Sobeys !), Atlantic 352 (incl 78 Lawtons, 123 convenience stores). Full data at Empire Company 2013 Annual Information Form
May 2012 BC 31 (26 Thrifty), Alberta 140 (109 Sobeys/IGA), Sask 15, Manitoba 31, Quebec 408, Atlantic 379,
locations by province as of March 2013 (Sobeys includes Safeway, Only Wal-Mart Supercenters listed)
| company | Ontario | Quebec | British Columbia | Atlantic | Alberta | Saskatchewan | Manitoba |
|
Loblaw Co |
459 |
232 |
84 |
121 |
84 |
35 |
28 |
|
Empire Co |
340 |
407 |
107 |
354 |
234 |
31 |
65 |
|
Metro Inc |
264 |
381 |
0 |
0 |
0 |
0 |
0 |
|
Wal-Mart |
105 |
16 |
25 |
- |
40 |
8 |
10 |
|
Overwaitea |
0 |
0 |
101 |
0 |
26 |
0 |
0 |
|
Costco |
27 |
19 |
6 |
14 |
2 |
3 |
Market Share
Based on data from the 2012 calendar year we can assume that Loblaw Companies market share is ~75% greater than Sobeys (based strictly on food retailing revenue at Loblaws and Empire Company Ltd). According to various sources (including Galen Weston Sr) each week Loblaw locations are visited by 14 million Canadians. Based on total food sales in the country, Loblaw food sales of between $26 and $28 billion would put its share of the entire food market at just over 32% (excludes gas, electronics, etc) ---> It follows that Sobeys market share is about 19% 5 basis points higher than Metro Inc at 14% (remember that Metro is not a Canada-wide grocer and that gas accounts for some $500m - $1b of revenue). Safeway Canada has annual sales of about $6.8B putting it in fourth place. In 2013-2014 expect Sobeys share of the food market to be a lot closer to Loblaws - Sobeys and Safeway together account for about 26% of the grocery market in Canada, less than 6 basis points behind Loblaw. Loblaws takeover of Shoppers Drug Mart does little to boost its market share position - in 2013 food contributed only $610 million of Shopper's $10 billion sales.
However, these supermarkets only hold a combined 63.0% of the total food market in Canada in 2012 (down from 63.5% in 2011, 67% in 2009); That according to a report released by the USDA on January 1, 2013. Excluding non-supermarket related stores such as convenience (Couche Tarde being the largest with 2012 revenue approximately 44% greater than Sobeys after being about the same in 2010), mass retailers (notably Walmart and Costo) and pharmacies, Loblaw Companies market share in supermarkets grows to nearly 50% with Sobeys second at 31.0% -excludes Safeway, and Metro at 21.9%. Canada Safeway is at 12.4% ($6.8b annual sales), Federal Cooperatives 6.1% ($3.35b), Overwaitea 5.2% (2.87b).
Altogether 2012 retail sales in Canada amounted to $C470 billion (US$469b) up from 2011 ($451b), 2008 ($425.3 billion), 2007 ($411.0 billion); in 2012 food accounted for 18.5% of retail sales ($87 billion out of $470b), down from 19% in 2011 ($88b/$451b), 18.5% in 2008 ($79b/425.3b). From 2013 to 2016 food sales are forecast to grow at a compound annual growth rate of 2%. Sales incr 17% between 2006 - 2011.
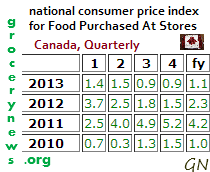
National Consumer Price Index (cpi) for food purchased in Canada quarterly
more... 2012 sales of frozen foods up 3% thanks to improvements in flavor and packaging.
Negatives
Losing out on A&P in July 2005 to Metro Inc. There was a bidding war between Metro and Sobeys but Sobeys was adament about not giving A&P a 15% stake in Sobeys which was something A&P preferred. A&P ended up costing Metro $1.7 billion (includes $500 million worth of Metro stock).
** Why losing A&P put Sobeys back: A&P operated over 200 stores under various banners mostly in Ontario. Ontario is Canada's biggest market and Sobeys is a distant third in terms of locations. Wal Mart's expansion there also hurts Sobeys chances of gaining market share. Taking a different approach to growth in Toronto, Sobeys converted a handful of its IGA locations to Sobeys locations in an attempt to gain recognition. Sobeys history in Ontario only dates back to the 1990's.
 The Oshawa Group deal, as big as it was, gave Sobeys no market share in BC. Most of its share there relies on smaller grocery stores.
* Owned 25% of Canada's third leading grocer Provigo from 1988 until Loblaw Companies took it over in 1998 (C$1.74B).
* Profit margins (not accounting for money from divestments) have traditionally been below industry average but are improving.
* The man who oversaw implementation of the company's growth development strategy, is retiring (June 29, 2012 officially).
* Due to disinflation it is increasingly difficult for supermarkets in Canada to pass down to customers any changes in labor and food costs. Target coming into the picture in 2013 definitely won't help things.
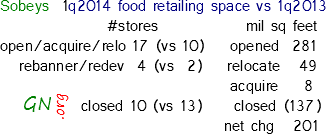
Locations
2006 - 1296 (543 corporate, 753 franchised); 60 drug stores (incl)
2010 - 1334 (633/701); 79 Lawtons
2011 - 1337 (629/708); 79 Lawtons
2013 - January - 1575 (736/839); Lawtons 79; gas stations 260 (236 shell/24 fast fuel), IGA 318 (stable), 29), 9 Cash and Carry, Price Chopper 15 (-30), FreshCo 68 (+11), Thrifty Foods 27 (+1), Needs 127 (-7), Rochenberry 20 (+1), Foodland 210 (+14), LCBO 35 (+6), Bonichoix 88 (-4), Sobeys 290 (+4)
2014 - January - 1569 (organic loss of six stores in fiscal 2013) +262 net locations from the Safeway deal (213 grocery less 23 sold as requested by the Competition Bureau, 10 liquor stores, 62 gas bars) = 1831 total
more.. Quebec is home to the highest number of locations at 596 but 200 of those are non food (Shell gas stations). Ontario is second at 334, Nova Scotia third at 228. Helping NS locations is the fact that virtually all of the companies drug stores (Lawtons) and convenience stores (Needs) are in NS.
The $1.5 billion acquisition of the Oshawa Group Ltd (operated around 1000 stores at the time) in November 1998 pushed the combined company's sales up to nearly $10 billion.
In December 2001 Sobeys divested itself of SERCA citing relatively poor profitability (the unit contributed 1/5th of revenue but less than 15% of ebitda; SERCA trailing ebitda margin was only 2.7% compared to 6.4% for Loblaws). Sobey's used most of of the money from the sale ($411M) to pay down debt ($660M at the time; $1.10B today (2Q2012).
Empire Company Limited's current CEO is Paul Sobey, grandson of the company's founder through David Sobey. Since 1999 Paul (chartered accountant; BComm from Dalhousie University) is also an Independent Director at the Bank of Nova Scotia.
Assets and Debt as of December 2013 '000000 $
| company | Loblaw Co | Empire Co | Metro Inc | Costco | Couche Tard |
|
assets change |
20,759.0 +16.0% |
12,240.7 +78.0% |
5165.4 -0.7% |
31,566.0 +15.0% |
10,367.2 -1.3% |
|
long term debt change |
6672.0 +33.0% |
3891.5 +290% |
804.4 -19.0% |
4985.0 +261% |
2779.5 -23.0% |